Science and Data Decisions
Greenprints serve as a bridge between data creators and practitioners by lowering technical barriers to accessing and using complex information. They reveal new insights by bringing information that was typically siloed across sectors into a single framework.

Common Themes and Datasets
Examples of themes found in greenprints across the U.S. and Internationally.
-
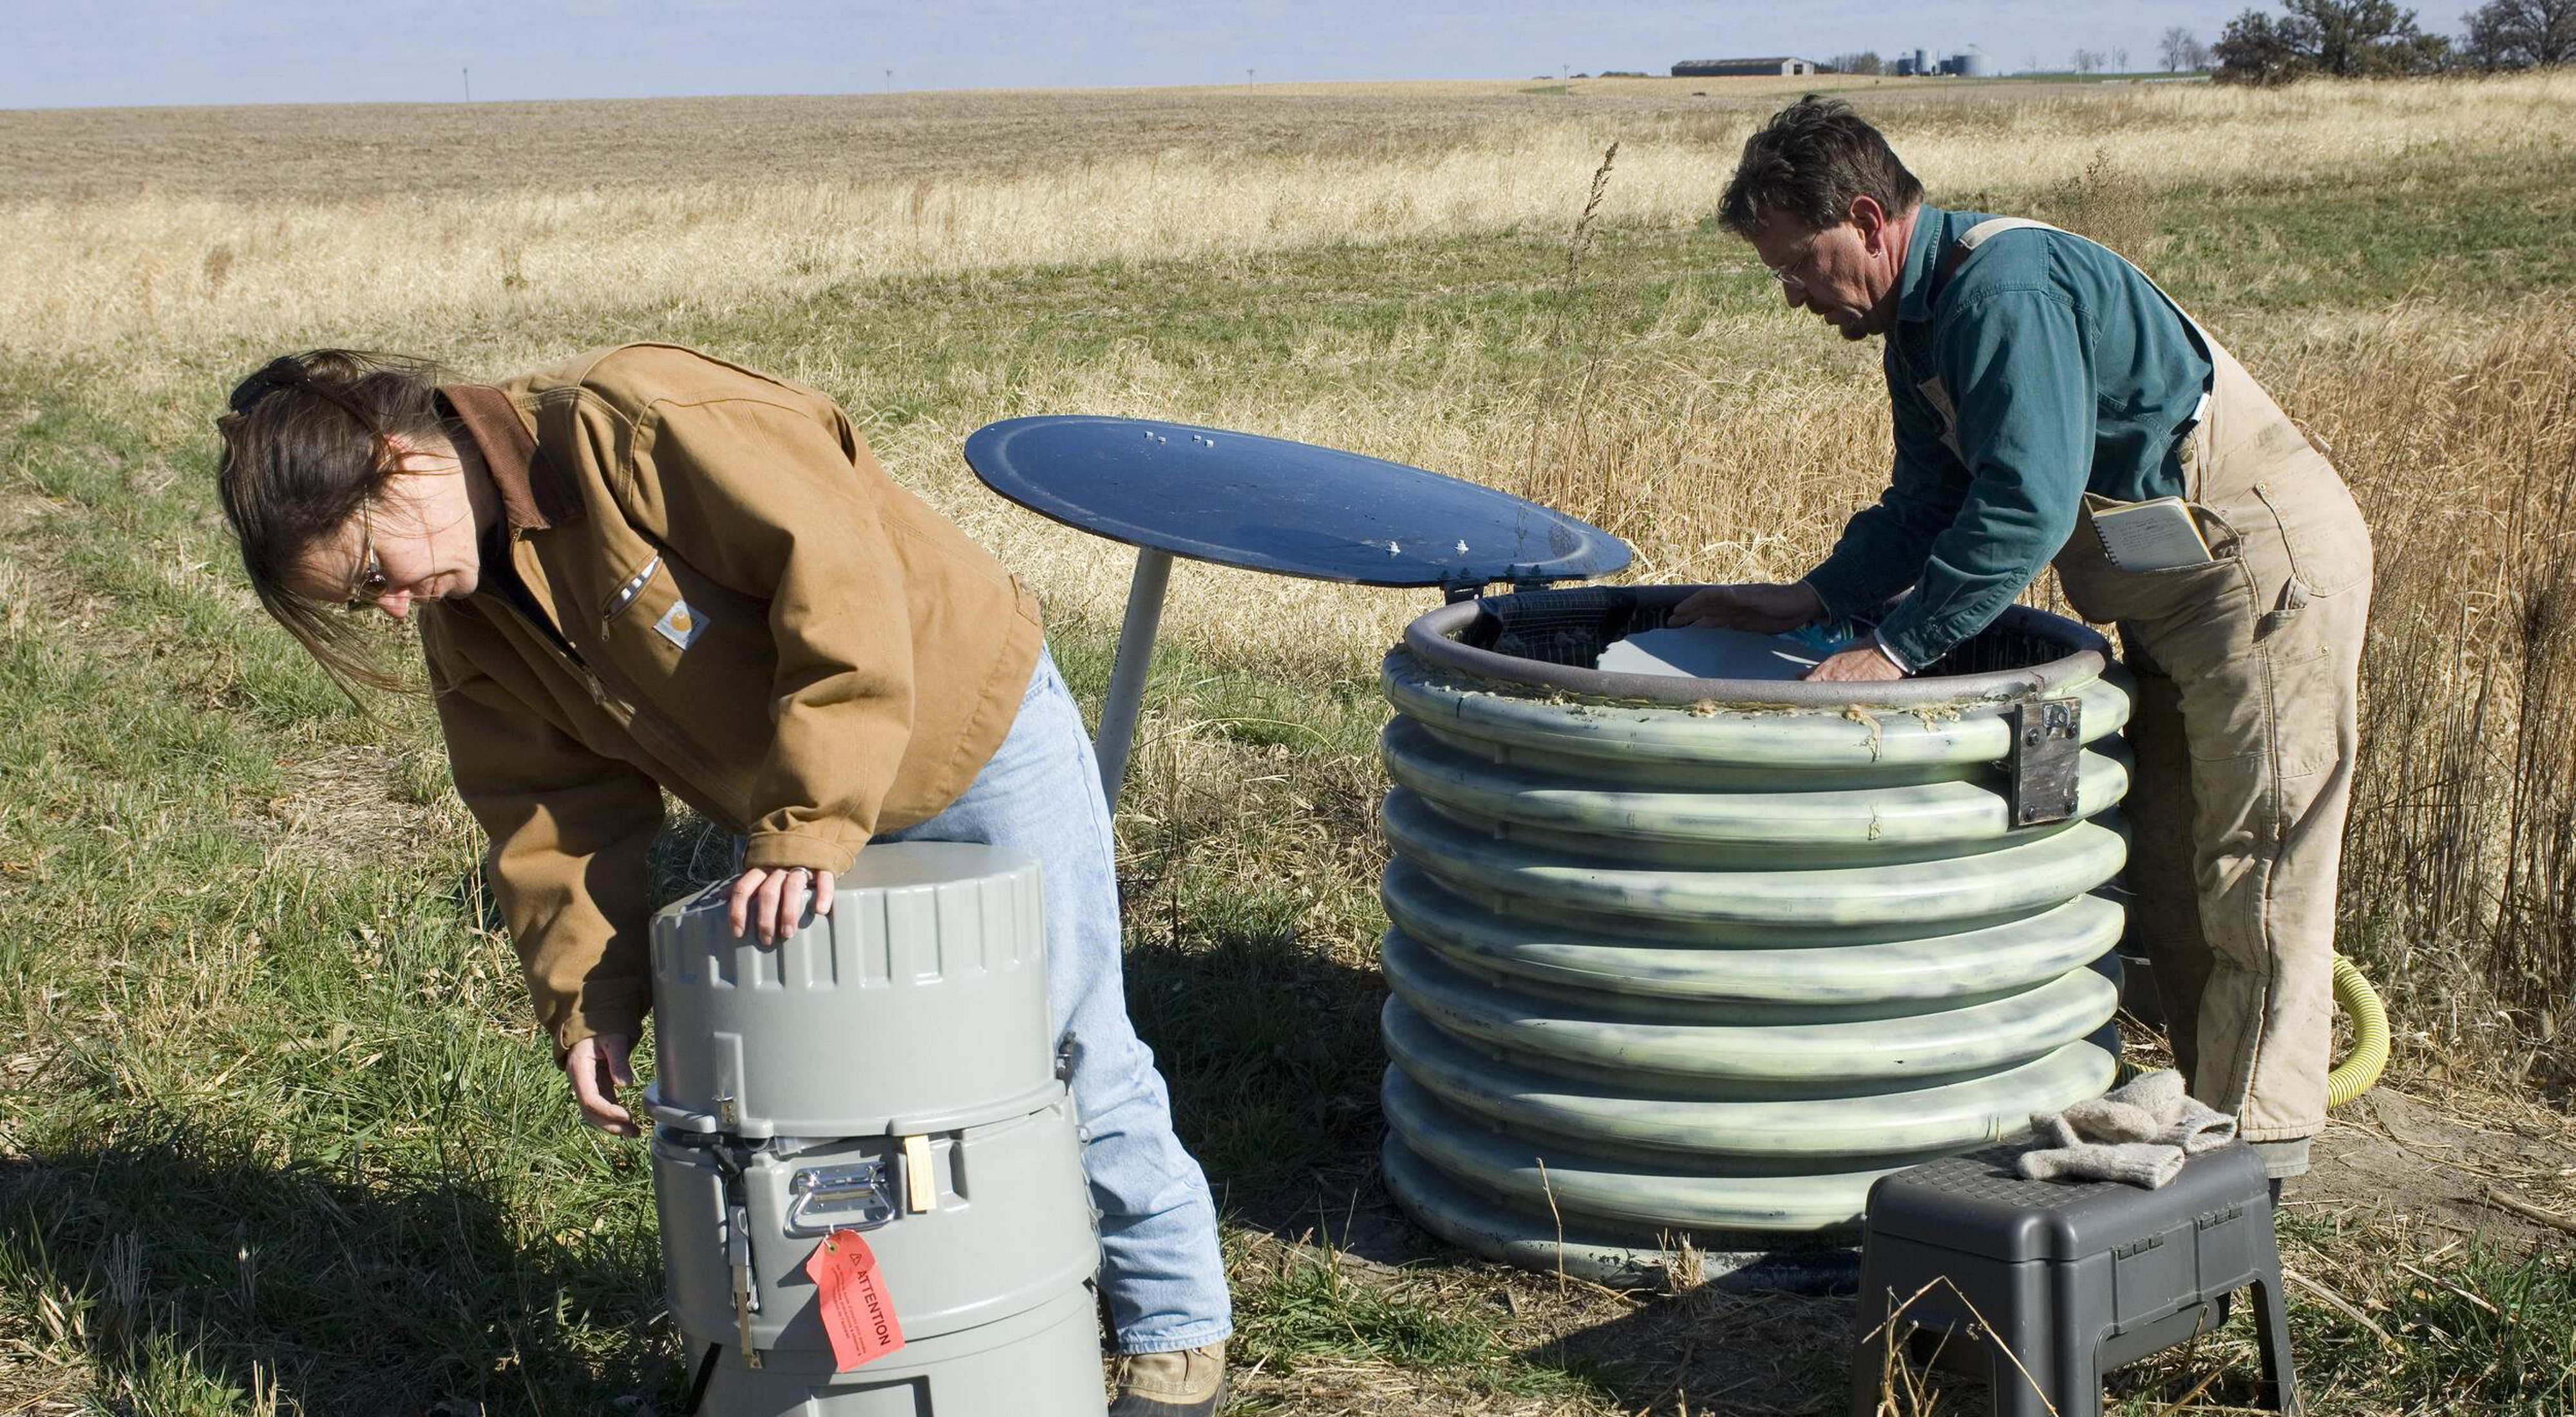
Water Quality and Supply
Ensuring access to clean water is essential for people, agriculture, diverse species, and healthy ecosystems. Datasets that support this theme include: watersheds, stormwater runoff, rivers and streams, and groundwater recharge zones.
-

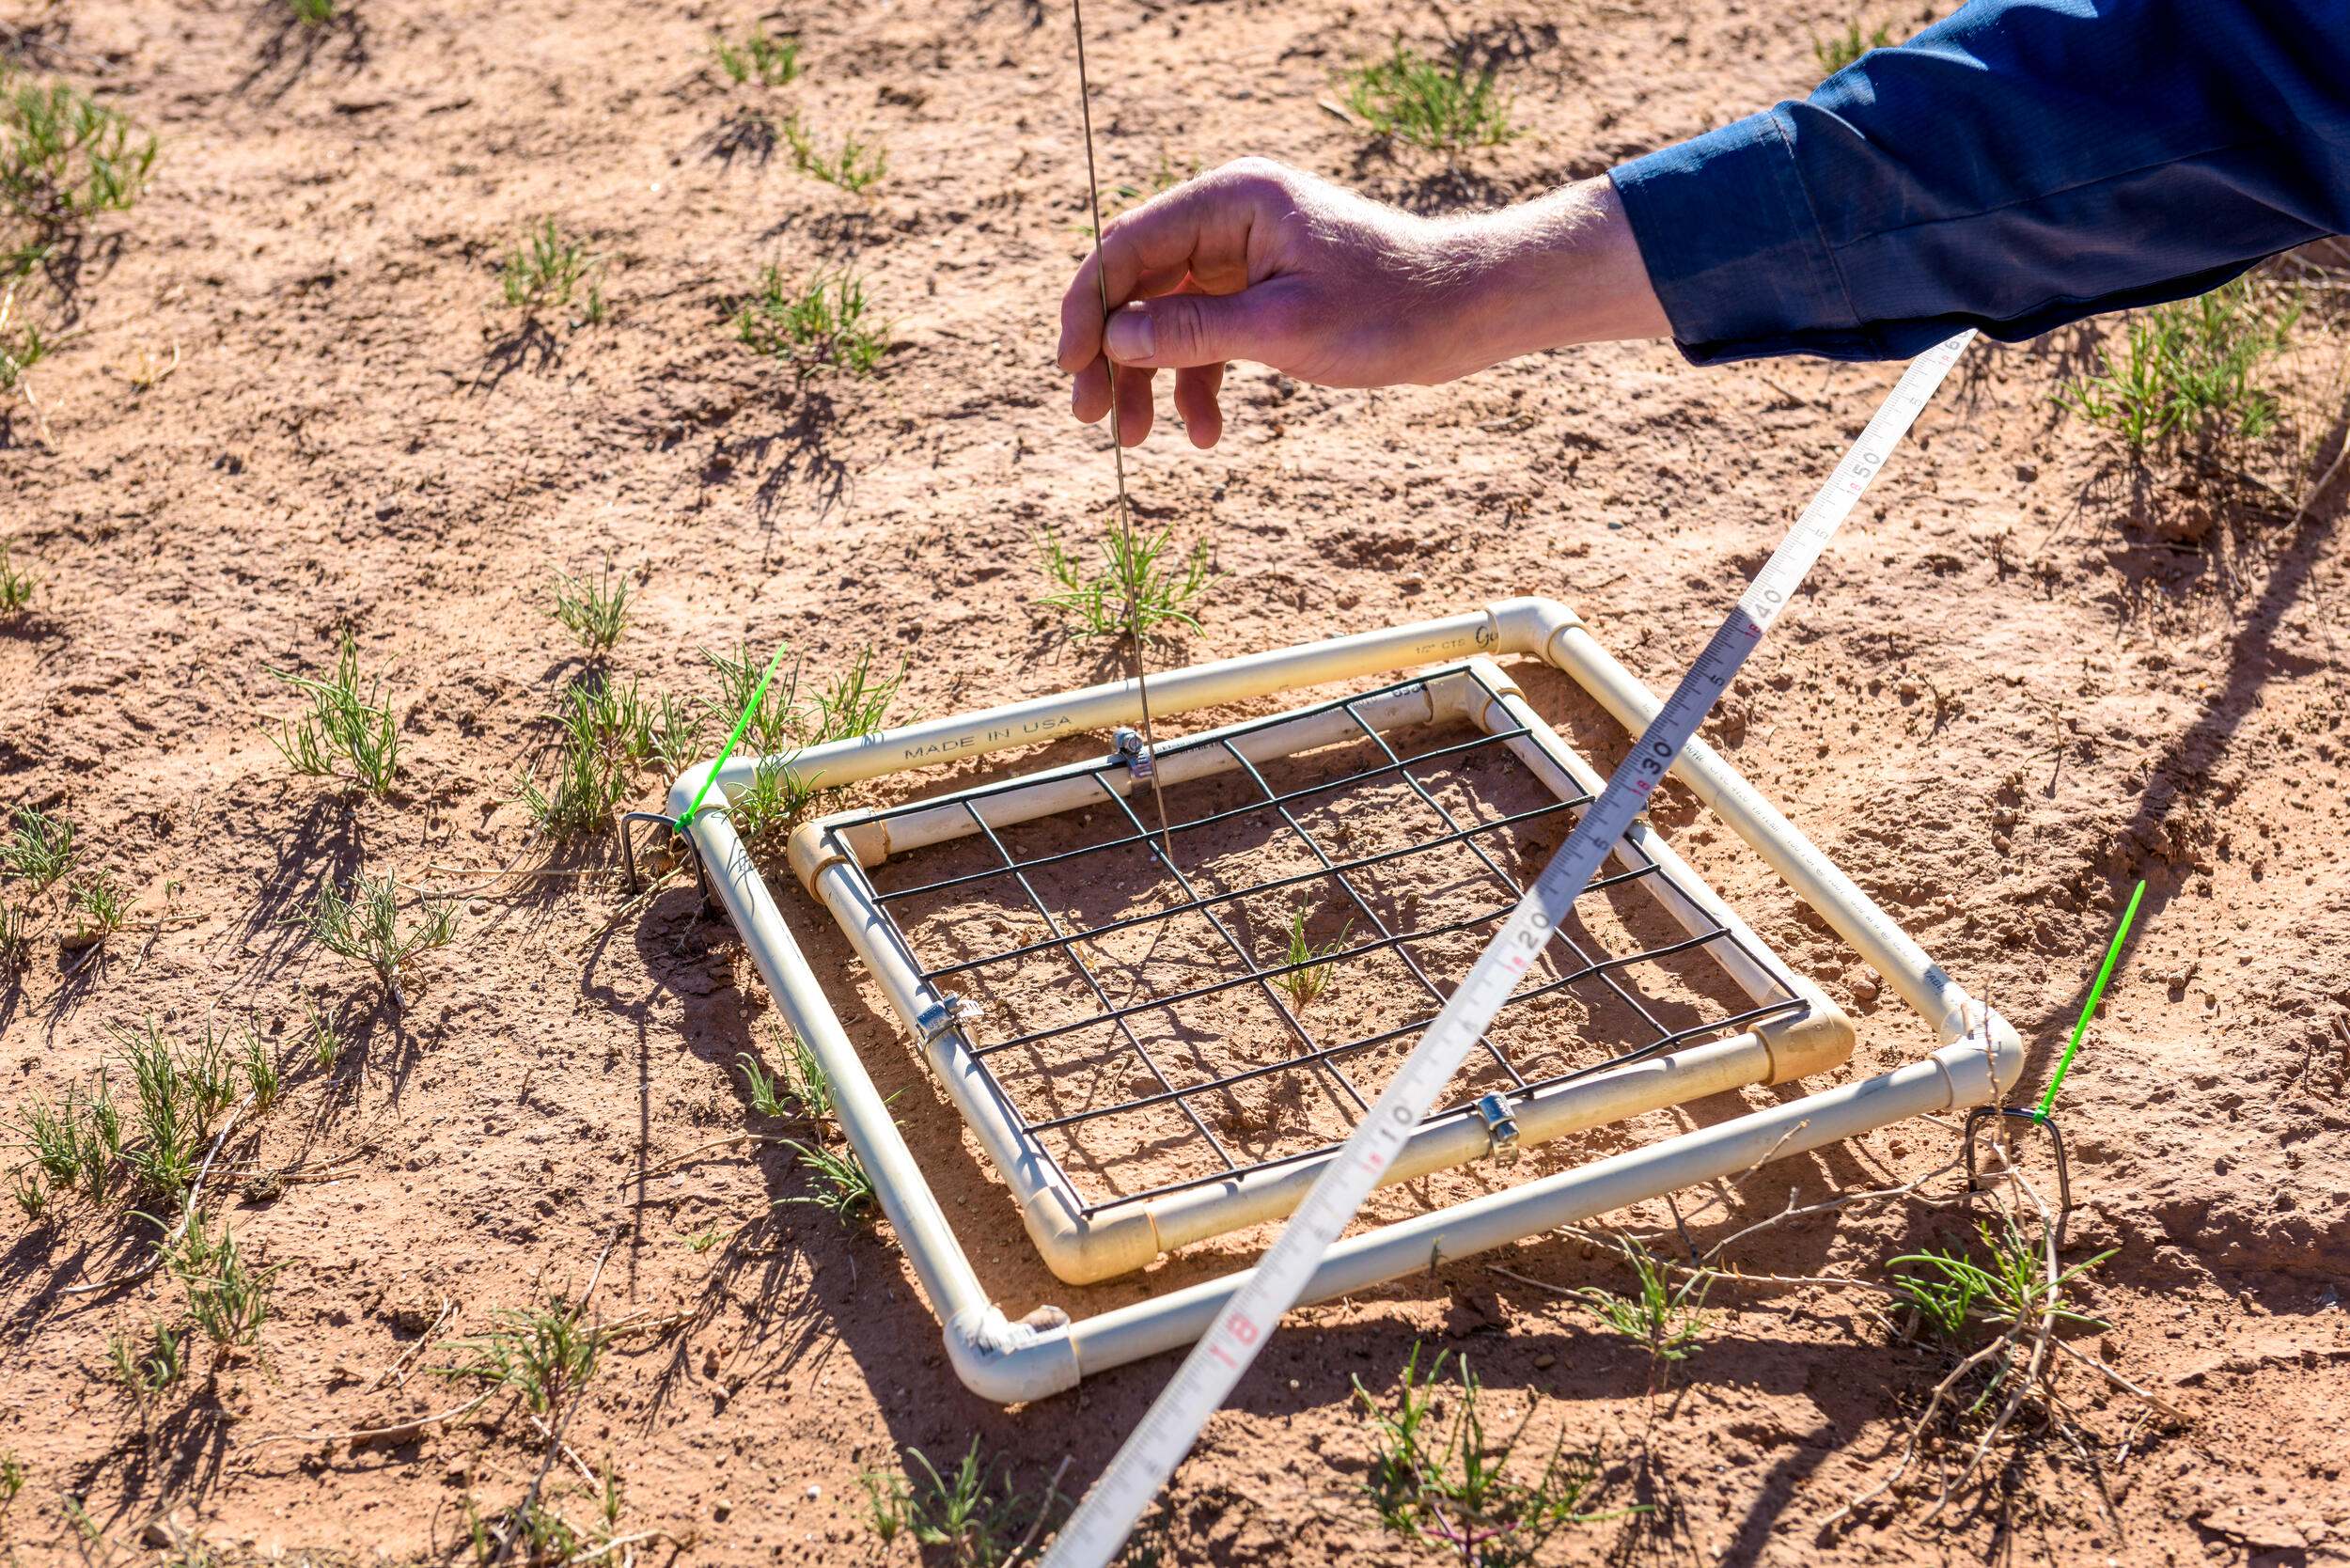
Biodiversity and Habitat
Conserving habitats and the natural linkages between them will allow plants and animals to thrive. Datasets that support this theme include: species habitat, rare species occurrences, and habitat connectivity.
-
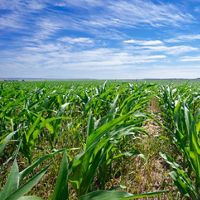
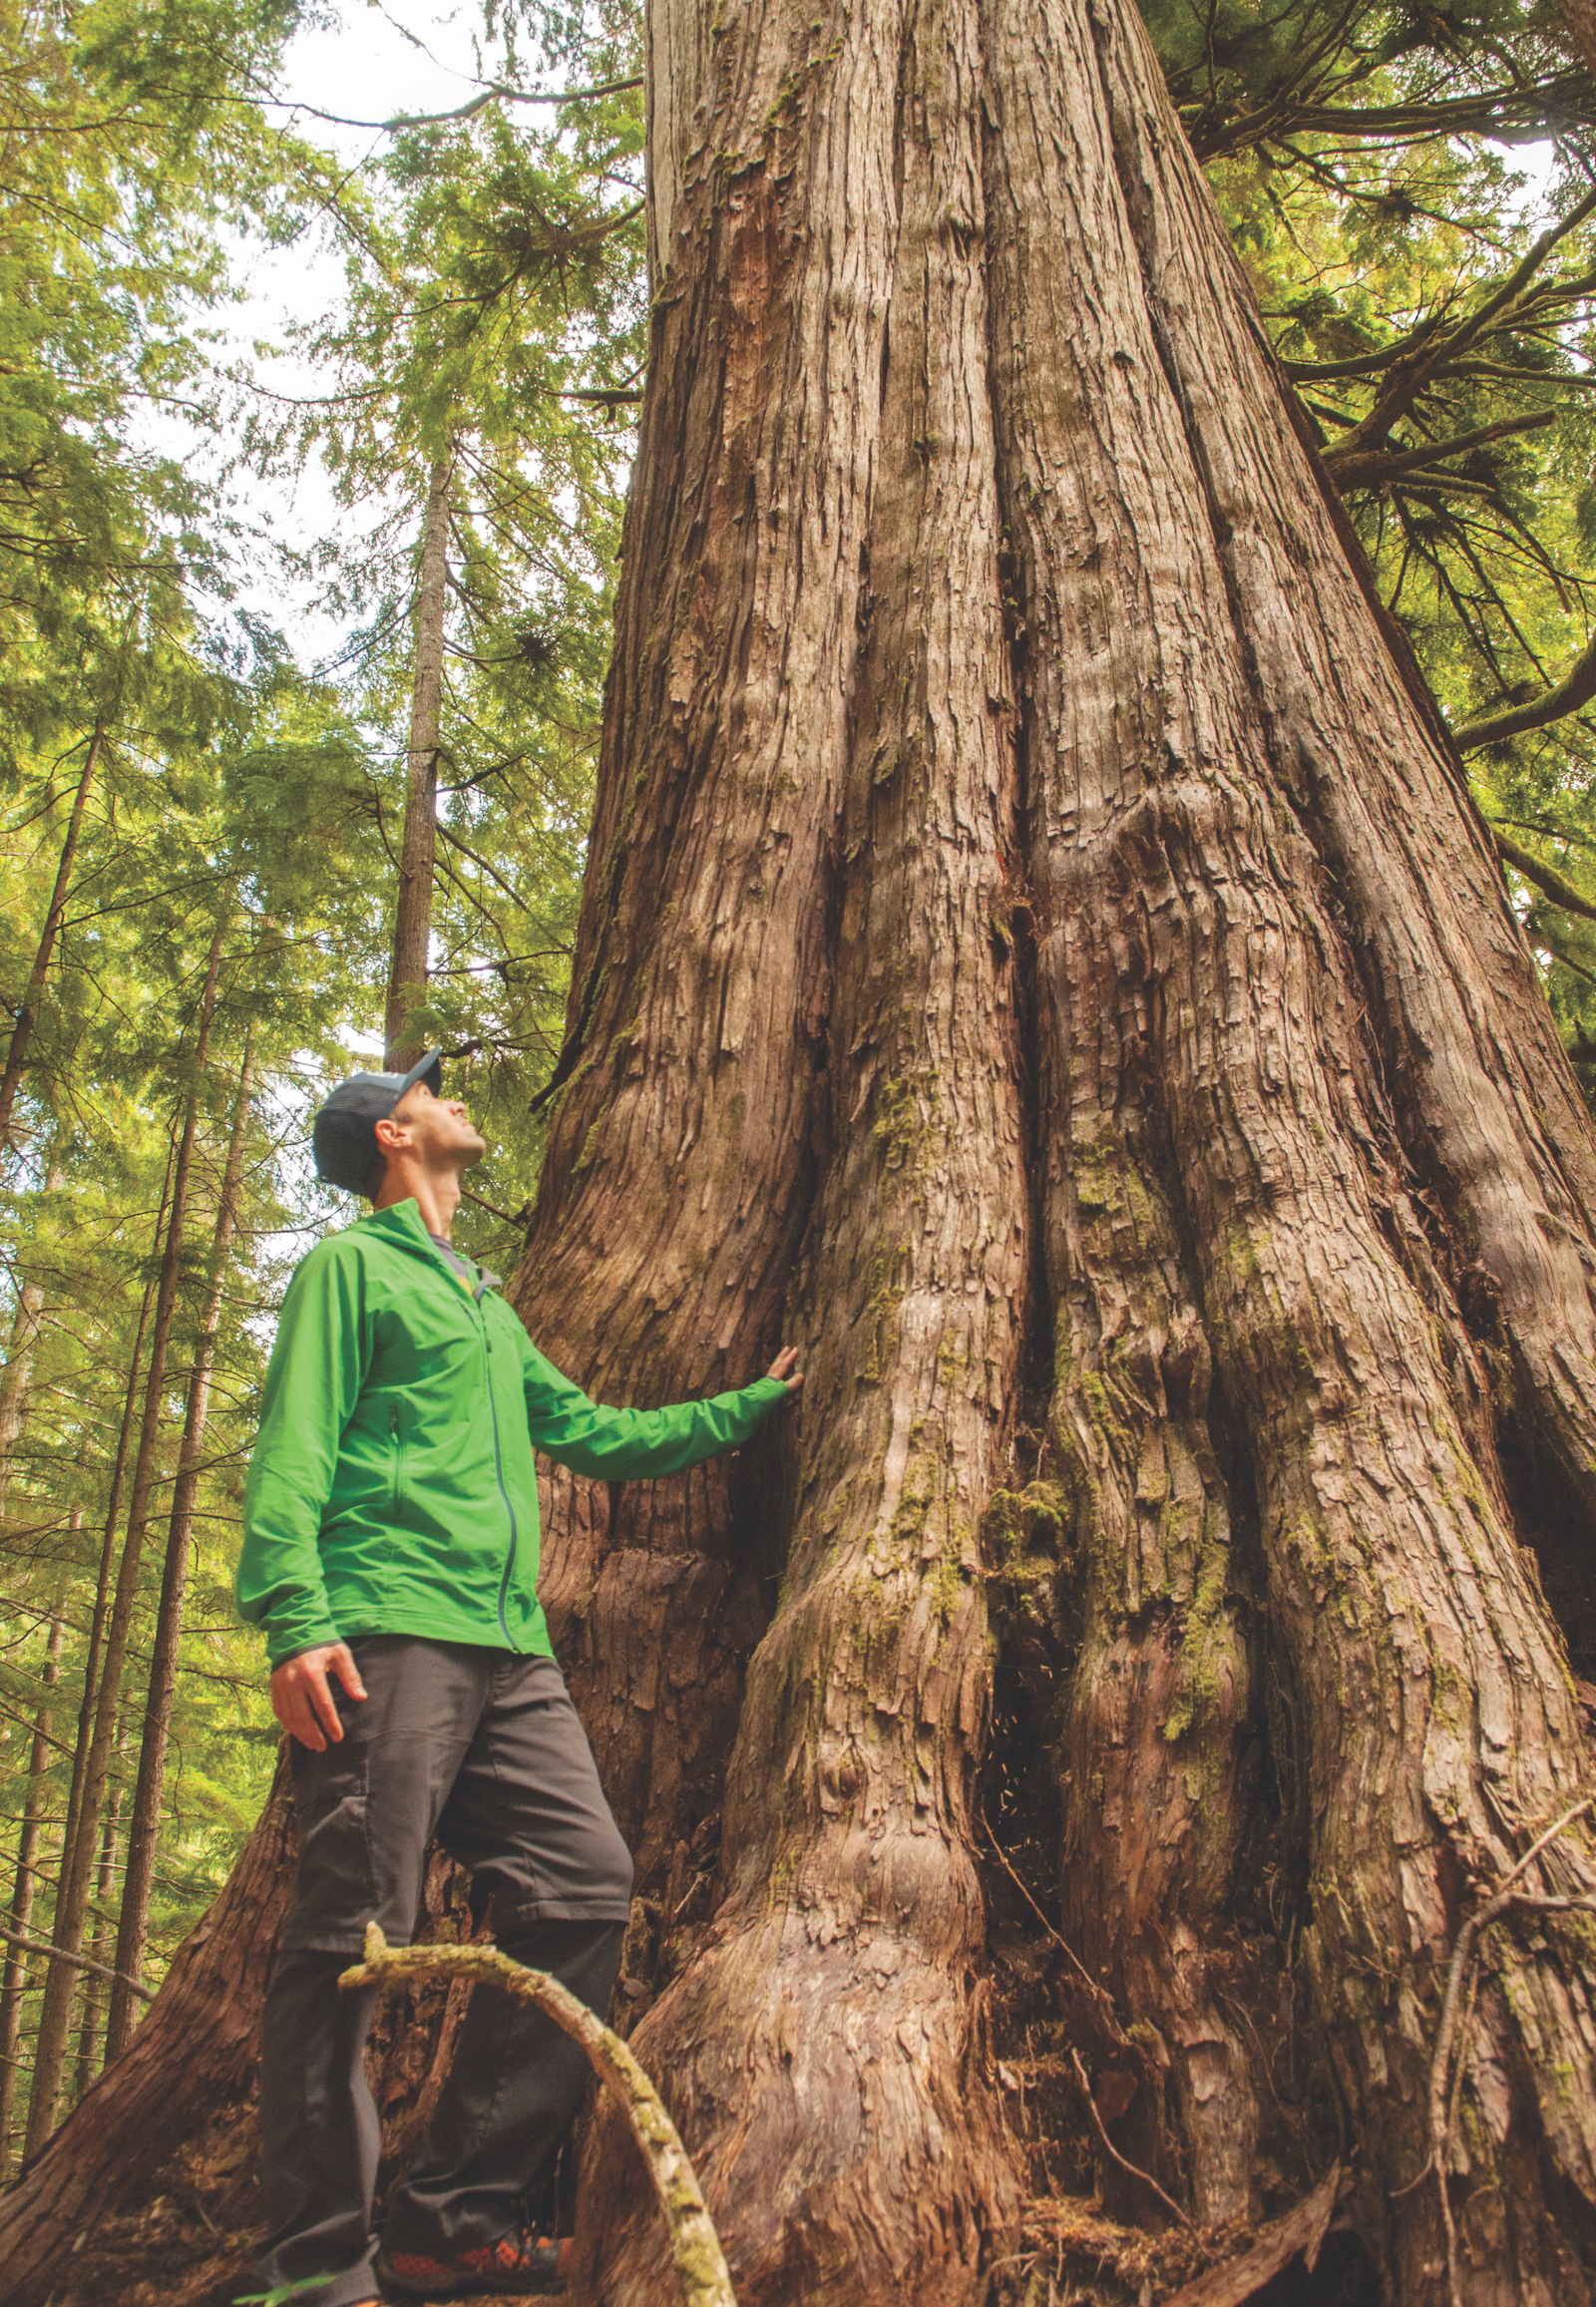
Rural and Working Lands
Working lands, including farms and ranches, produce food and fuel, provide jobs and support the local economy. Datasets include: farm and ranch land data, areas for fishing, hunting, or foraging, rural character, viewsheds and dark skies.
-
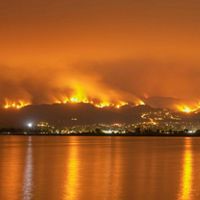
Climate Resilience
Building resilience to flooding, wildfires, and heat islands will strengthen communities and ecosystems. Datasets for this theme include: carbon sequestration, flood risk, extreme heat risk, wildfire risk, coastal protection, and air quality.
-

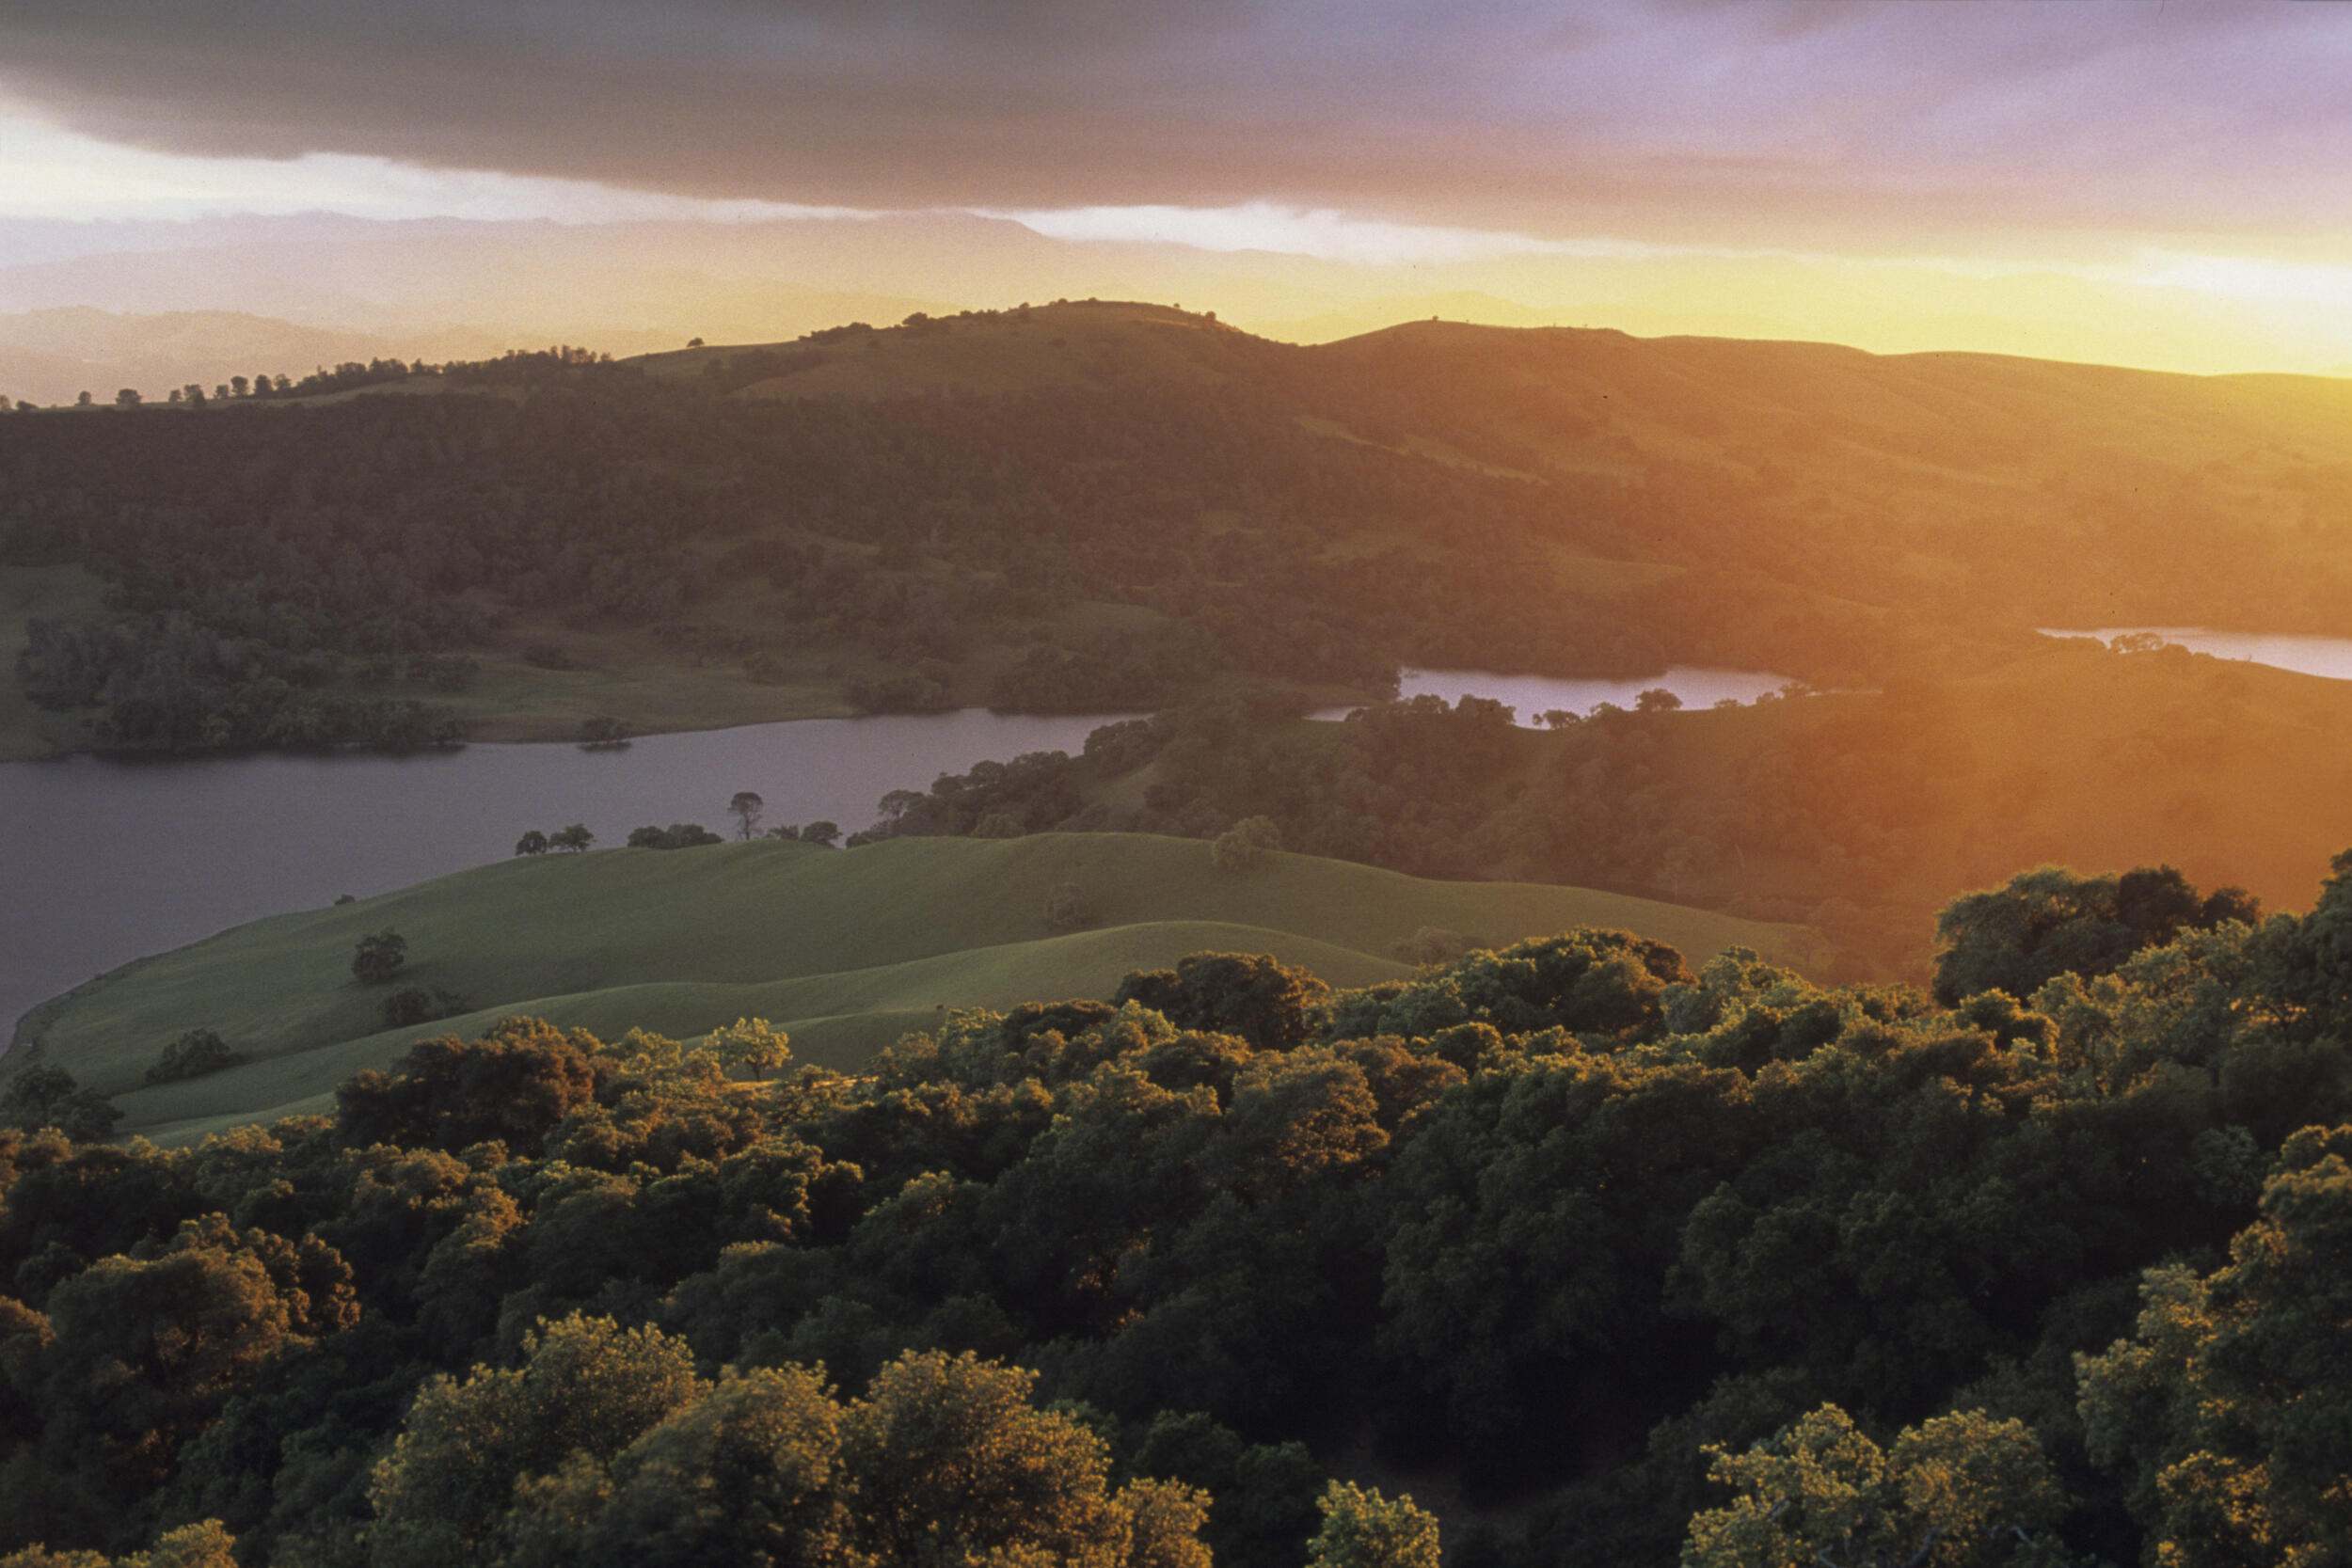
Parks and Open Space Access
Open space provides wildlife habitat and benefits our health via air quality, space for recreation and reducing extreme heat. Datasets include: publicly accessible protected lands, access to parks and trails, and access to nature-based programming.
-

Cultural and Historic Resources
Cultural resources are crucial for providing a sense of community and understanding the historical value of the place. Datasets include: indigenous traditional territories, sacred sites, and designated historic sites.
-

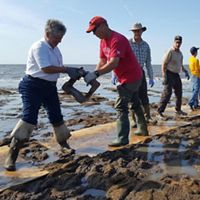
Health and Equity
Environmental hazards unduly impact marginalized communities. Datasets include: air quality and pollution, socioeconomic vulnerability, food and healthcare access, housing, employment, transportation access, health inequity and poor health outcomes.
-
Partnership and Funding Opportunities
Strategic partnerships and funding opportunities build support and resources to achieve goals. Datasets include: places to partner with Indigenous groups, service area overlaps for agencies and organizations, and priority areas for funding sources.

Spatial Analysis
Most datasets in a greenprint can be displayed spatially and should correspond to a resource goal or a theme. Relevant datasets can be gathered from experts in different fields as well as crowd sourced from end users, partners, and anyone else engaged in developing a greenprint.
After gathering a comprehensive list of potential data that represents all resource goals, narrow down the list by identifying the most recent, high-quality, trusted, and relevant crucial data for your targeted user groups and chosen geography. It is worth noting that in the United States, there are many national-scale datasets, but local sources may have higher accuracy and resolution and therefore may be more useful to and trusted by local decision-makers and advocates.
In a greenprint, the chosen datasets can be conveyed to users in two ways:
- As spatial layers displayed on a map;
- In a report summarized into metrics for an area of interest.

A graphic containing a headline of Natural Resource Dashboard, followed by the question of, how do Bay Area counties stack up? Below that is a bar graph showing percent of land protected by county. The counties are, in order, Marin, San Mateo, Contra Costa, Napa, Santa Clara, Alameda, Sonoma, San Francisco, and Solano.
Greenprint Metrics
Metrics summarize and interpret the data for an area of interest. Metrics (sometimes called measures or outputs) can be presented in a table, a chart, or as a numerical value with associated text. For example, for a resource goal of “protecting water quality,” one metric could be “10.2 miles of impaired streams are within the area of interest.” Knowing the extent of impaired streams can help users determine where to prioritize water quality improvements.
Each dataset can be summarized in many ways, leading to multiple options for metrics. To list a few examples of basic metrics for the above example of water quality, the greenprint could report on:
- The number of impaired streams
- The total length of impaired streams, or
- The percent of streams in the area that are impaired.
Metrics should be chosen that will be most interpretable and useful for the audience of each greenprint.
Metrics can be more than “just the facts.” They can include trends or contextual information that help convey the significance of a natural resource. The following are types of metrics that help explain why a certain quantity of a resource is or is not important using the “impaired streams” example.
- Just the facts (“X miles of impaired streams”)
- Regional significance (“This area contains X% of the impaired streams in the state”)
- Landscape context (“X miles of impaired streams are within protected areas that house threatened species.”)
- Risk level to the resource (“X miles of unimpaired streams are in an area at risk of development, which could lead to more water pollution.”)
- Inequitable distribution (“There are X more miles of impaired streams in low-income communities than in high-income communities.”)
- Historical trends (“The number of impaired streams has increased by X% over the past 20 years.”)
- Thresholds that can impact ecological or human health. (“Having more than X amount of impaired streams may have an impact on local drinking water sources.”)
Sharing this contextual information with end users could lead to users implementing different actions. For example, if users know that a resource is inequitably distributed, they may want to focus restoration efforts in low-income or pollution-burdened communities.
Greenprints may provide solely descriptive metrics (as highlighted above), that summarizes information to describe conditions of a resource on the landscape.
Greenprints can also be designed to provide action-oriented metrics that offer solutions or recommendations related to resources. For example, a descriptive metric would report that “there are 10 acres in this area impacted by urban heat island effects”; whereas an action-oriented metric would add that “planting street trees in this area can help cool temperatures to address the effects of urban heat islands.” Deciding whether to use descriptive or action-oriented metrics depends on the goals, users, and developers of the greenprint.
In order to provide transparency and build trust with potential users, each dataset and metric should also be linked to a data definition and a source.

A graphic with a headline that reads: Relationship between themes, metrics and data. Below is a visual representation of downward arrows with text that reads the following: themes are broad categories that provide structure to the data; questions related to themes that support the goals of the greenprint; summaries and statistics used to answer the key questions; spatial information that reflects the best available science or analysis.
| Theme | Key Question | Metric | Data |
|---|---|---|---|
| Water Quality | Where does our drinking water come from? | Project area includes a drinking water source area. Pollution in this area could impact drinking water quality. | Drinking water source areas in Oregon from the Department of Environmental Quality |
| Are there natural lands that help enhance water quality? | Acres of natural lands buffering streams and rivers. | National Hydrography Dataset Plus; National Land Cover Data | |
| Biodiversity and Habitat | Which areas are critical for species moving in response to climate change? | Acres of land within a climate linkage. | Connectivity and climate flow from The Nature Conservancy Resilient Land Mapping Tool |
| What is the richness of plant and animal species? | Number of species observed within project area. | India Biodiversity Portal | |
| Rural and working lands | Where are the most productive agricultural soils? | Acres of prime agricultural land | Irrigated Capability Class from the USDA Soil Survey Geographic Database |
| Where are opportunities to expand access to healthy foods? | Number of community gardens within 5 miles. | GreenThumb Community Garden Map from NYC Parks | |
| Climate Resilience | Which areas are at high risk of wildfire? | Acres with very high likelihood of wildfire. | Wildfire Risk to Communities from the USDA Forest Service |
| Where is carbon stored in the landscape? | Metric tons of CO2 equivalent stored in vegetation. | Wildland carbon storage in California from Gonzalez et al. 2015 | |
| Which areas are at risk of flooding? | Acres within the 100-year floodplain. | FEMA Flood Maps | |
| Park and Open Space Access | Where is the potential to expand access equitably to outdoor recreation? | Acres with a very high need for park access (residents in that area are currently more than a 10 minute walk from a park). | Priority areas for new parks from the Trust for Public Land |
| Where is there high urban heat risk due to insufficient open space and tree canopy? | Temperature difference between urban centers and surrounding rural areas. | Urban Heat Island in 5 cities from the Sustaining Urban Places Research Lab | |
| Cultural and Historic Resource | Which indigenous people traditionally inhabited this region? | The traditional territories of the project area. | Native Land Digital |
| Does the area contain designated historic sites? | Number of registered historic places within the project area. | National Register of Historic Places from National Park Service | |
| Health and Equity | What is the exposure level to air pollution in this region? | The national percentile of PM2.5. | Environmental Justice Screening and Mapping Tool from US EPA |
| Is there equitable access to public transportation? | The statewide percentile of transportation access. | Transportation Equity in Massachusetts from MassROUTES | |
| Partnership and Funding | Which governement agencies manage lands in the area? | Ownership of public lands adjacent to the project area. | Protected Area Database from USGS |
| Are there priority development areas that have financial benefits? | Whether or not the project area falls within an Opportunity Zone. | Opportunity zones in Chicago from the City of Chicago |
Water Quality
-
- Metric: Acres of natural lands buffering streams and rivers
Natural land cover in the active river area filters excess sediment and pollutants from surface runoff before the runoff enters rivers thereby benefiting water users downstream by maintaining or enhancing water quality.
- Dataset (US): National Hydrography Dataset Plus; National Land Cover Data
-
- Metric: Your project area includes a drinking water source area. Pollution in this area could impact drinking water quality.
- Dataset (local): Drinking water source areas in Oregon from the Department of Environmental Quality
Biodiversity and Habitat
-
- Metric: Acres of land within a climate linkage.
These linkages are the last remaining natural lands within a modified landscape, and they also connect current climate conditions to similar conditions in the future. Maintaining habitat connectivity within these linkages will help facilitate species movement through climate change.
- Dataset (US): Connectivity and climate flow from The Nature Conservancy Resilient Land Mapping Tool
-
- Metric: Number of species observed within your project area.
- Dataset (local): India Biodiversity Portal
Rural and Working Lands
-
- Metric: Acres of prime agricultural land.
- Dataset (US): Irrigated Capability Class from the USDA Soil Survey Geographic Database
-
- Metric: Number of community gardens within 5 miles. In urban areas, community gardens can provide access to healthy foods.
- Dataset (local): GreenThumb Community Garden Map from NYC Parks
Climate Resilience
-
- Metric: Acres with a very high likelihood of wildfire. Fuels management and controlled burns can help return fire to its beneficial role.
- Dataset (US): Wildfire Risk to Communities from the USDA Forest Service
-
- Metric: Metric tons of CO2 equivalent stored in vegetation. Vegetation in this region is at risk of development, and any disturbances in this area would release greenhouse gas emissions.
- Dataset (local): Wildland carbon storage in California from Gonzalez et al. 2015
-
- Metric: Acres within the 100-year floodplain.
Climate change may increase the extent of flooding. Green infrastructure can help mitigate the impacts of flood water to urban areas.
- Dataset: FEMA Flood Maps
Parks and Open Space Access
-
- Metric: Acres with a very high need for park access (residents in that area are currently more than a 10 minute walk from a park).
Many parks in this region are inequitably distributed, with more access to parks in higher income communities. Parks have health and recreation benefits, and it is important to increase accessibility to parks for all urban residents.
- Dataset (US): Priority areas for new parks from the Trust for Public Land
-
- Metric: Temperature difference between urban centers and surrounding rural areas.
Urban heat islands, due to impervious surfaces and lack of canopy cover, can lead to heat-related illness and death. Planting trees can provide shade and cooling.
- Dataset (local): Urban Heat Island in 5 cities from the Sustaining Urban Places Research Lab
Cultural and Historic Resource
-
- Metric: The traditional territories of the project area. Knowing the historical and ongoing presence of Indigenous peoples in the region acknowledges their connections to the land.
- Dataset (US): Native Land Digital
-
- Metric: Number of registered historic places within the project area. Historic places may have special protections or restrictions on development.
- Dataset (US): National Register of Historic Places from National Park Service
Health and Equity
-
- Metric: The national percentile of PM2.5.
High levels of PM2.5 can cause health problems, such as respiratory issues, especially for vulnerable populations. Vegetation can help filter out air pollutants including PM2.5.
- Dataset (US): Environmental Justice Screening and Mapping Tool from US EPA
-
- Metric: The statewide percentile of transportation access.
In general, marginalized communities have lower access to public transportation, but are also more impacted by harmful air pollution from the transit system.
- Dataset (local): Transportation Equity in Massachusetts from MassROUTES
Partnership and Funding
-
- Metric: Ownership of public lands adjacent to the project area. Nearby agencies may be interested in engaging in a partnership.
- Dataset (US): Inventory of protected areas from USGS
-
- Metric: Whether or not the project area falls within an Opportunity Zone. Developments in communities identified as Opportunity Zones may be eligible for tax incentives.
- Dataset (local): Opportunity zones in Chicago from the City of Chicago
